
+ 49 160 16 29 5 29
hannah @ rauss . net
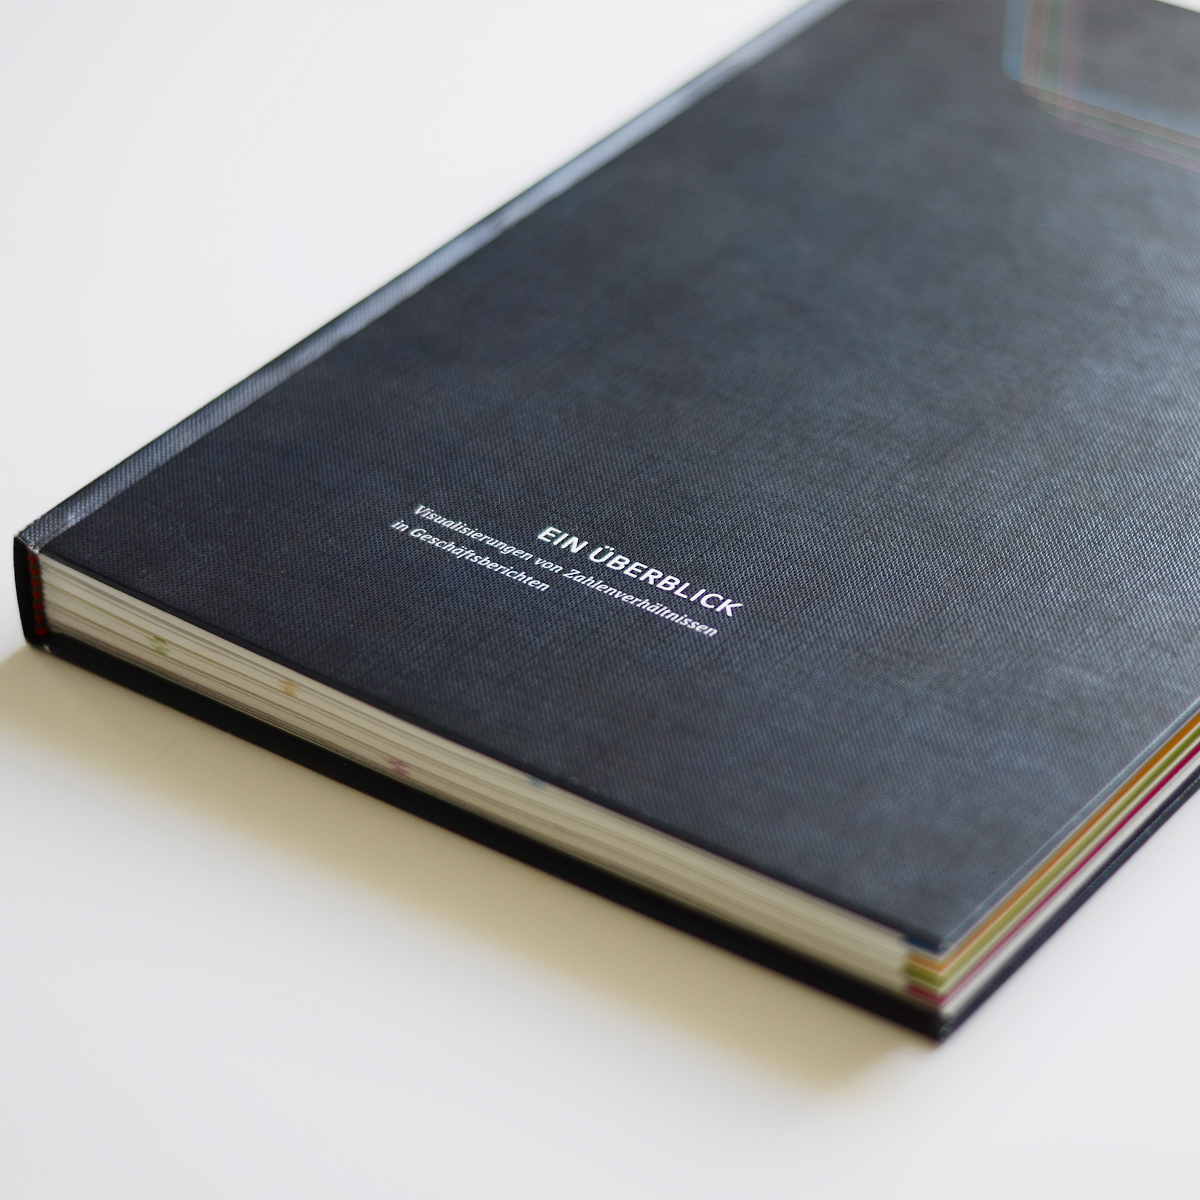
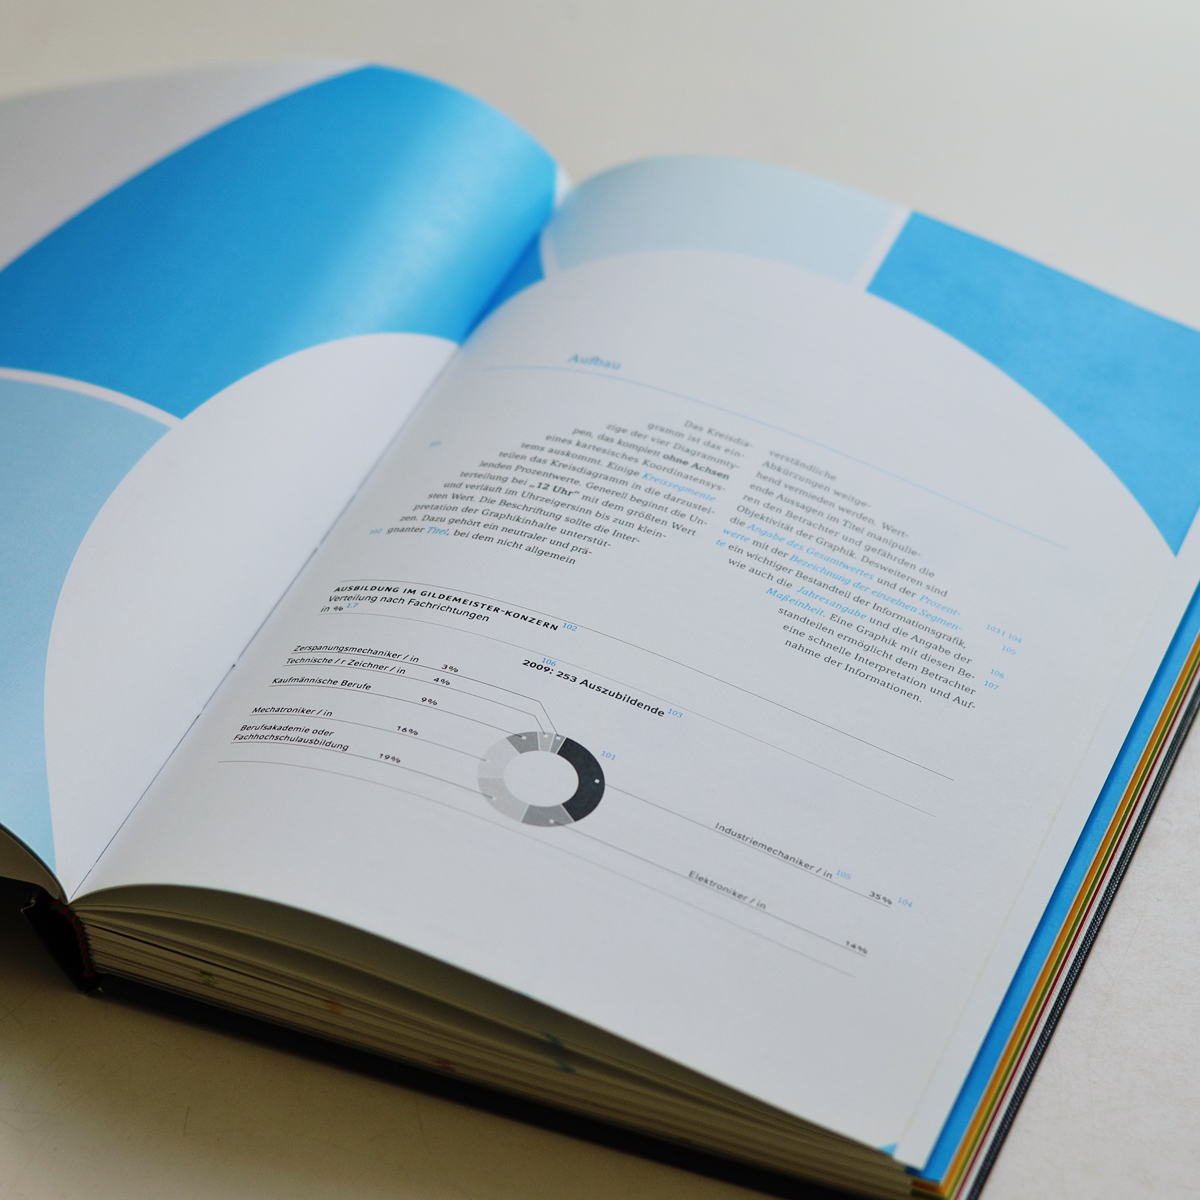
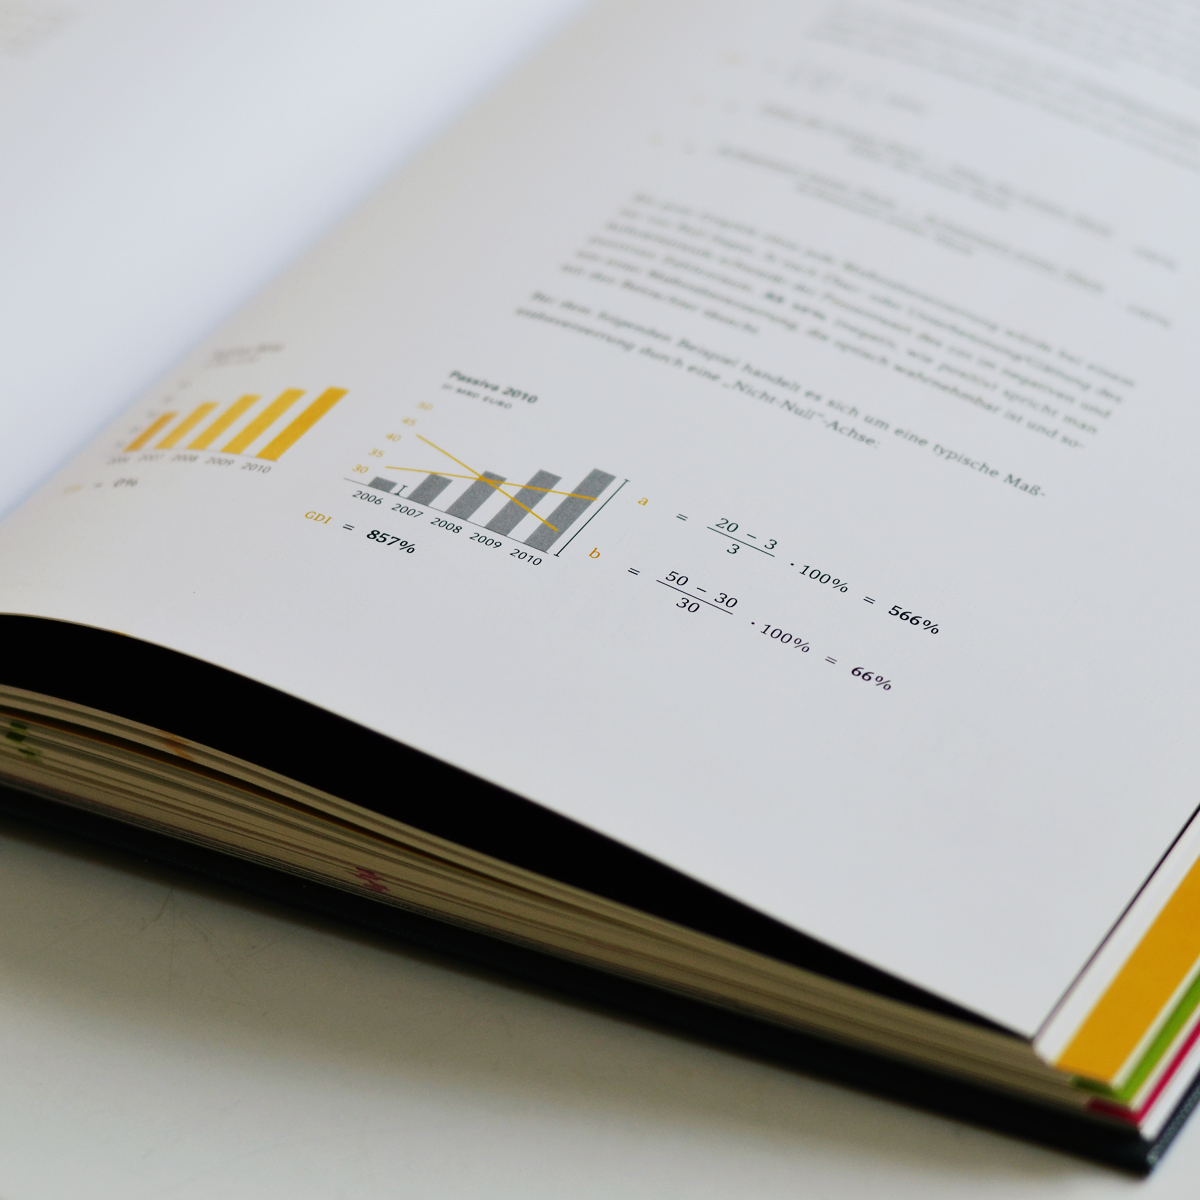
Im Hinblick auf die Geschäftsberichte der letzten 5 Jahre gibt es viele negative, aber auch einige positive Beispiele von Diagrammen. Zusammengefasst und analysiert geben sie einen umfassenden Überblick über die Varianten der Diagramme, Innovation, Aufbau, Wahrnehmung, Täuschungen & Manipulationen.
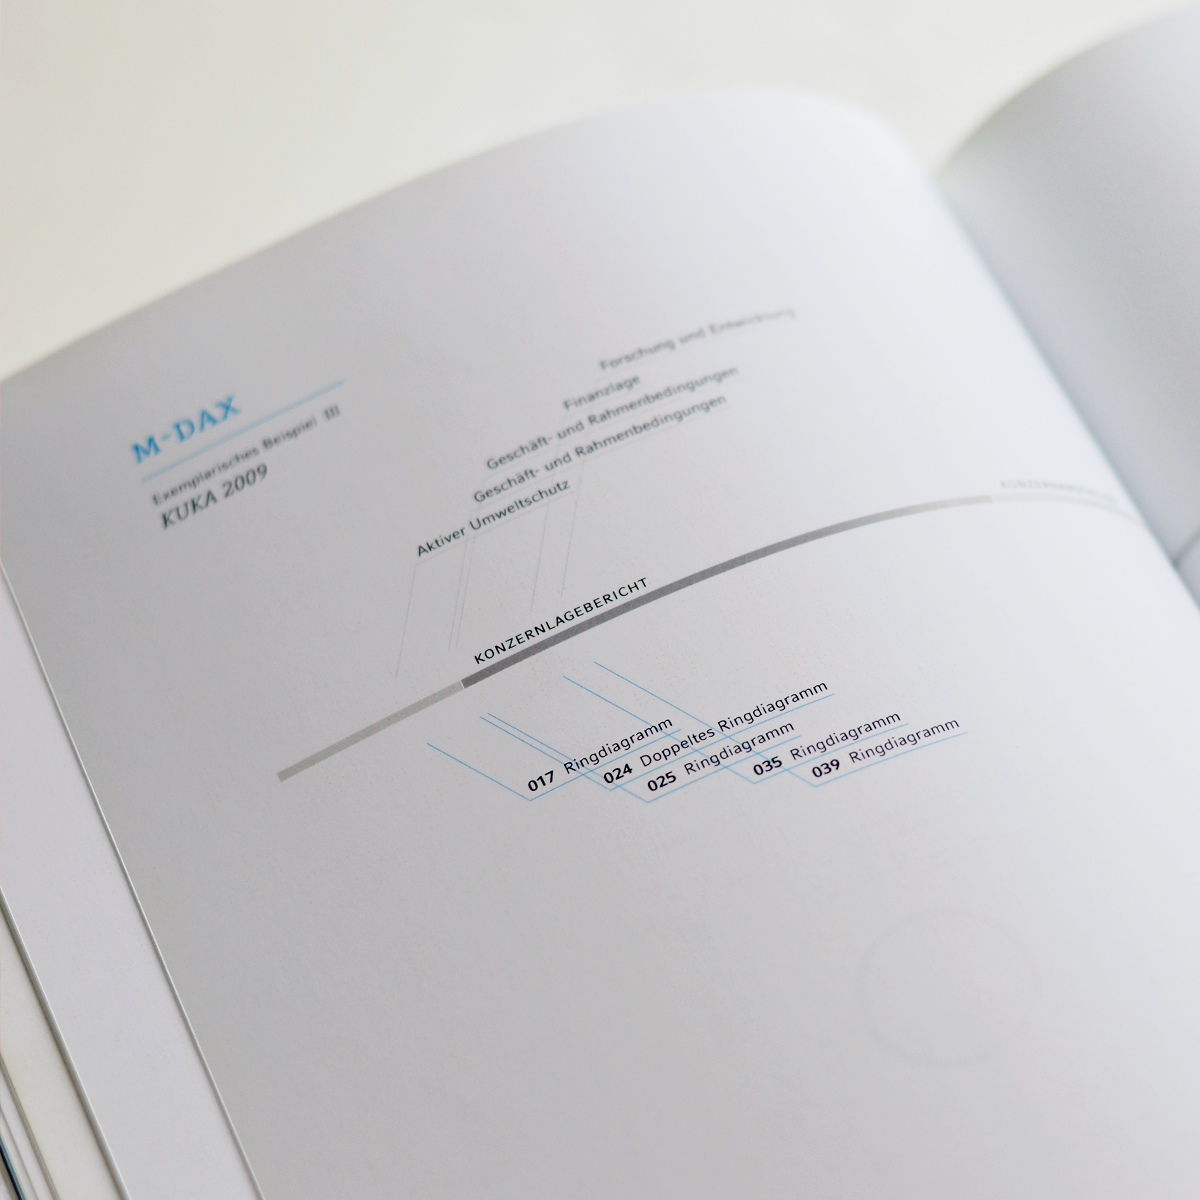
Neben diesen grundlegenden Informationen, dienen 15 aktuelle Geschäftsberichte als exemplarisches Beispiel. Ermittelt wurden die besten 3 Geschäftsberichte jedes Indizes anhand ihrer Bewertungen von 2006 bis 2009 – geprüft durch das CCI (Corporate Communication Institute, Münster). Der Überblick, der durch die 15 Geschäftsbericht entsteht, veranschaulicht die Anzahl der Diagrammformen, die Anwendungsgebiete und deren Platz im Geschäftsbericht, verschiedene Variationen, Beispiele für die Gestaltung und die Themen der Diagramme.
If you look at the annual reports of the last five years there are a lot of negative and some positive examples for charts. Summed up and analyzed they create a extensive overview over the variants of charts, innovation, composition, perception, deception and manipulation.
Along with this basic information, the 15 current annual reports serve as exemplary example. The top three annual reports of every index were determined with the help of their evaluations from 2006 to 2009 - audited by the CCI (Corporate Communication Institute, Münster). The overview that was created from the 15 reports shows the number of chart types, the fields of application and their place in annual reports.


